WHY CHOOSE THE COMPLETE BUNDLE?
Advanced Tri-Band Spectrum Analysis
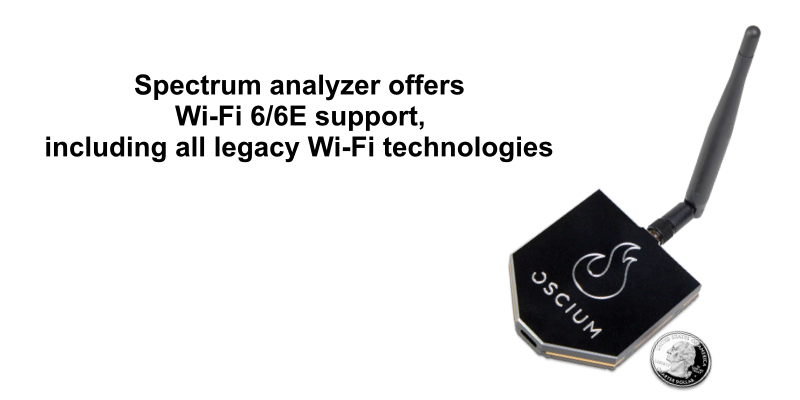
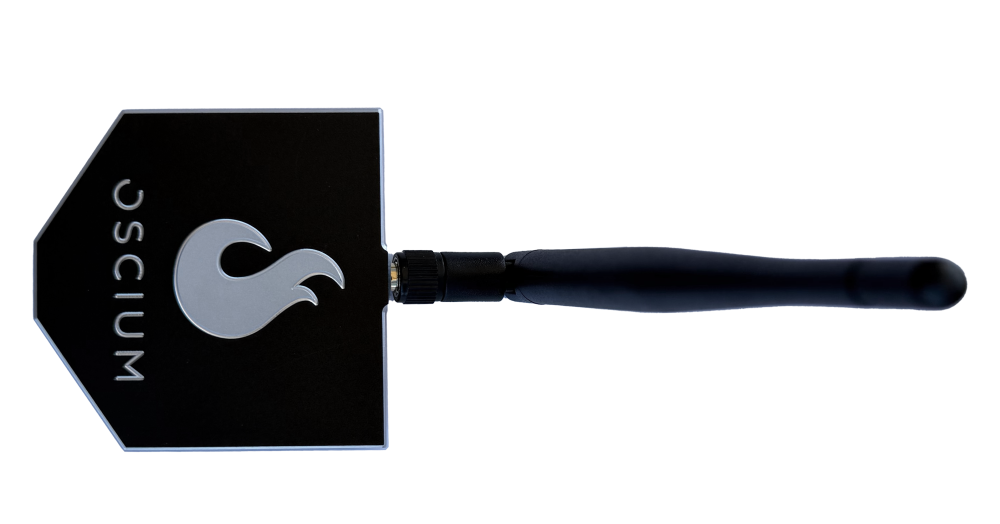
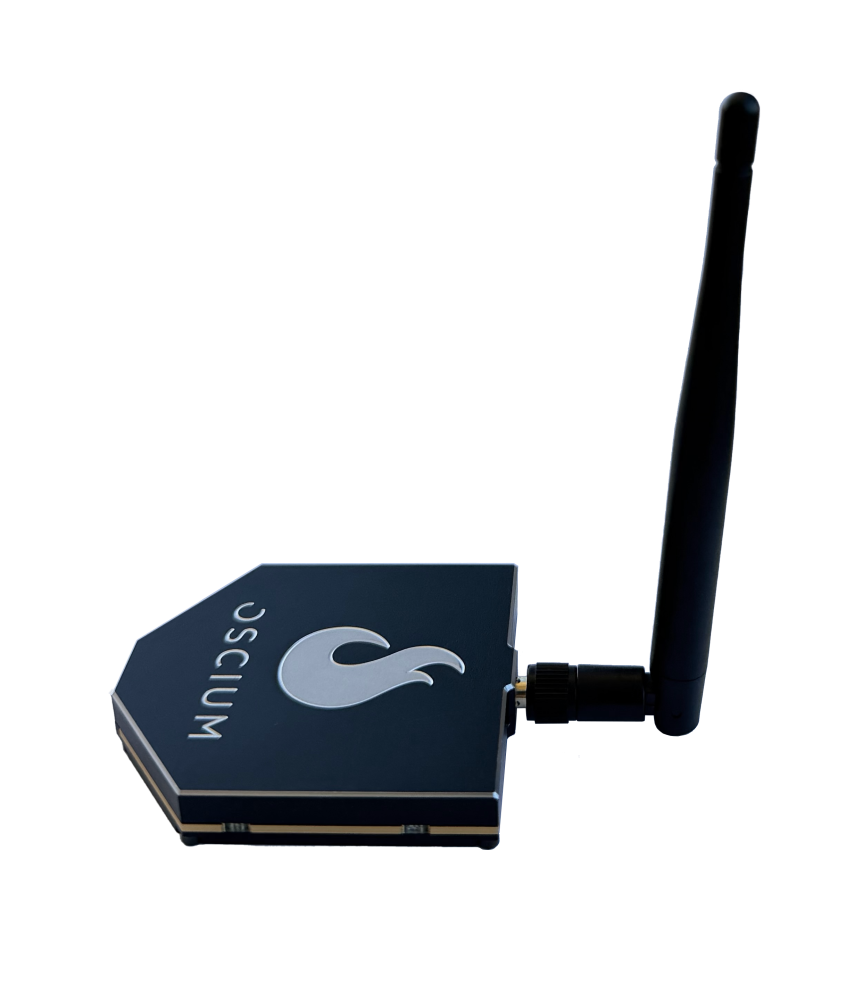
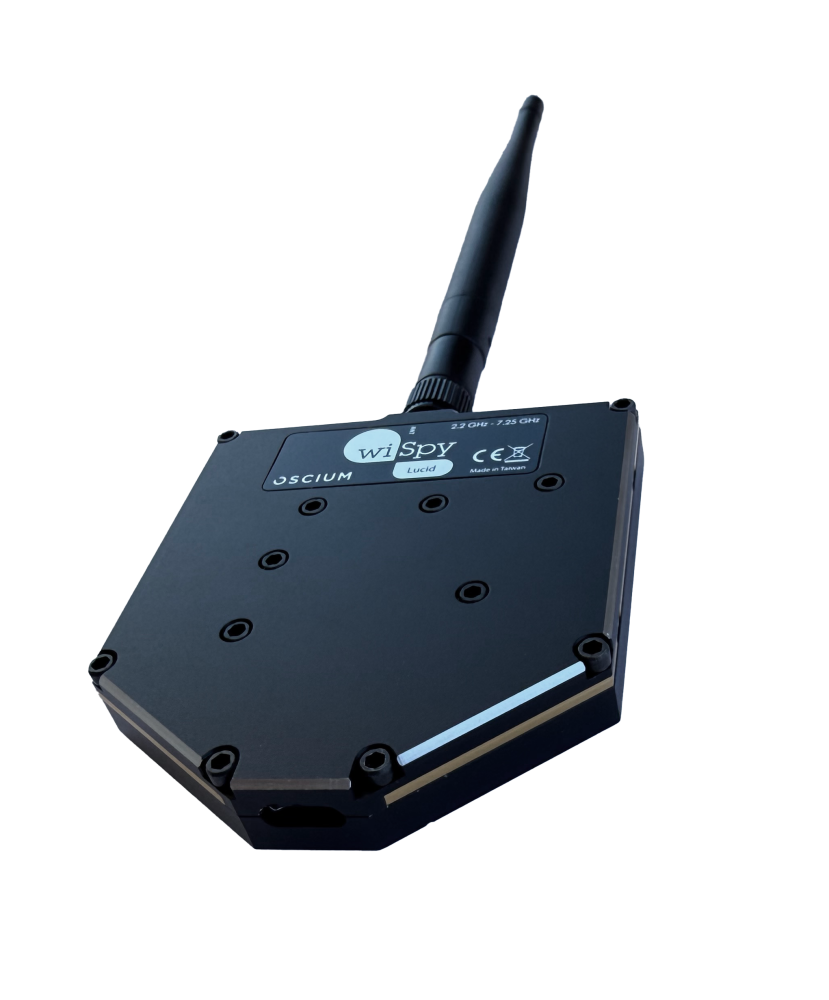
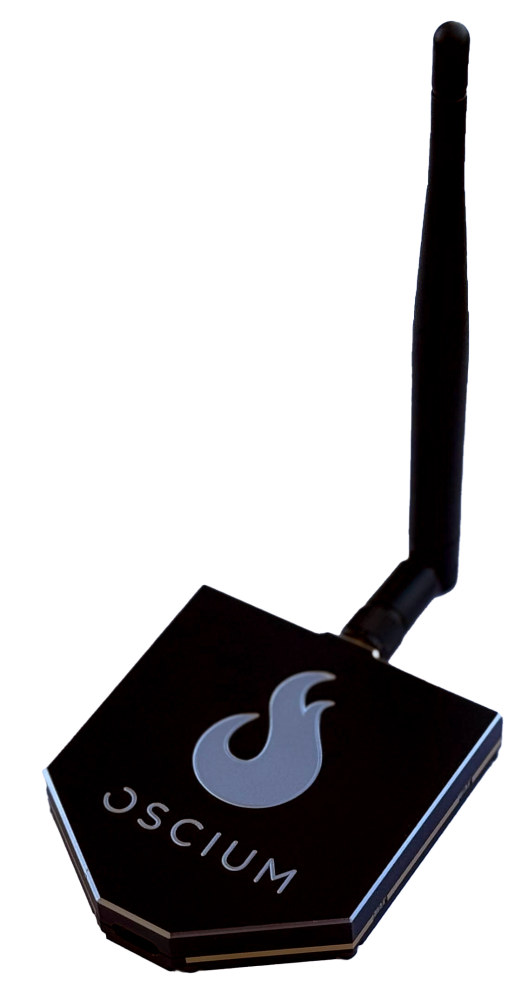
Wi-Spy Lucid gives you full visibility into 2.4 GHz, 5 GHz, and 6 GHz (Wi-Fi 6E) bands, monitoring both Wi-Fi and non-Wi-Fi activity with pinpoint precision. Paired with Chanalyzer’s visualization tools, it’s like putting on glasses after years of squinting—you’ll finally see your network clearly in real time.
Pinpoint and Eliminate Interference
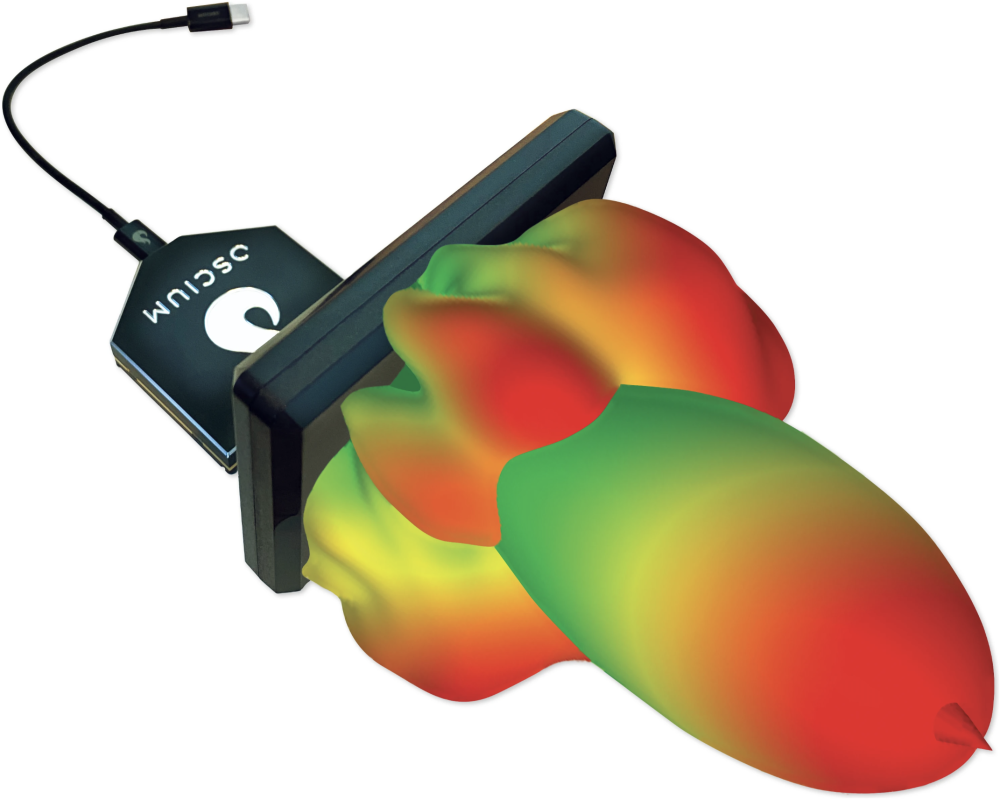
With the Interference Finder Antenna, you’re not just looking for interference—you’re hunting it down. This directional antenna focuses your efforts, helping you zero in on the exact source of disruptions (goodbye, mystery microwave) so you can take action.
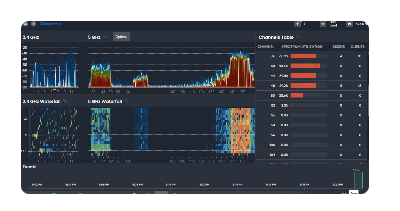
Monitor Channel Saturation and Intermittent Issues
Chanalyzer doesn’t just show you a list of access points; it gives you the full RF story. By combining Wi-Spy Lucid’s insights with AP data, you can analyze channel usage, manage congestion, and finally track down those annoying, intermittent interference gremlins.
Identify and Fix Wi-Fi Dead Spots
Nobody likes a Wi-Fi dead zone. Whether you’re planning a new network or keeping an existing one running smoothly, Chanalyzer’s tools let you map SSID signal strength and spot gaps in coverage. The result? Seamless connectivity and happier users.
Effortless Reporting for Clear Communication
Turn your findings into reports that don’t just inform—they impress. With Report Builder, you can quickly add snapshots, tables, and descriptions to create visually compelling PDFs that even your boss (or clients) will understand.
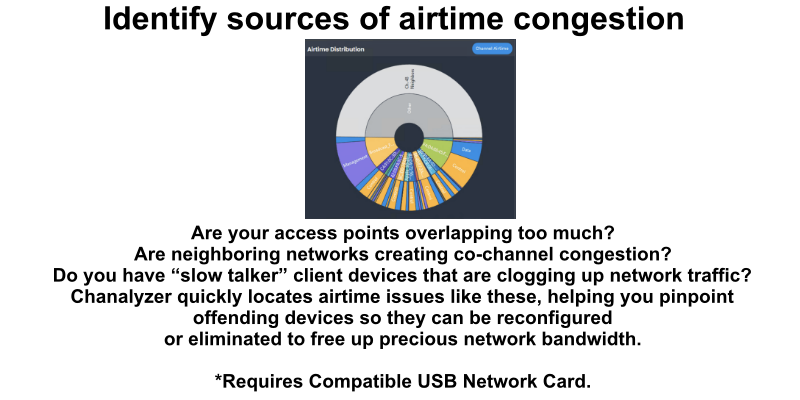
Powerful Data Visualization
Unlike a typical protocol analyzer, MetaGeek App uses multi-layer pie charts to visualize network traffic. This allows you to quickly view airtime utilization for all access points, client devices, and packet types transmitted on a selected channel. With just a few clicks, you can identify problematic devices without sifting through hundreds of lines of packet data.