WHY CHOOSE THE SPECTRUM BUNDLE?
Advanced Tri-Band Spectrum Analysis
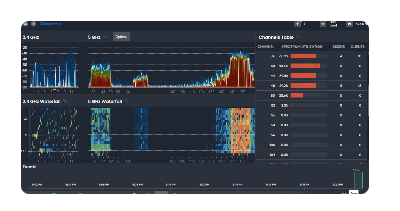
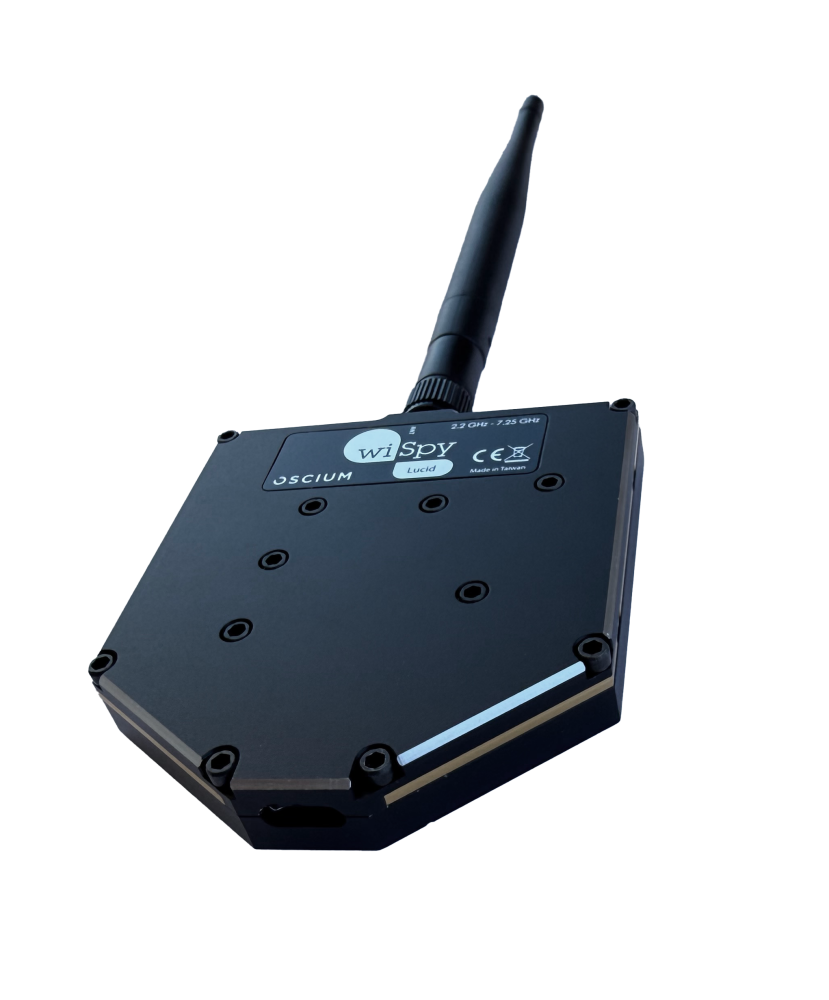
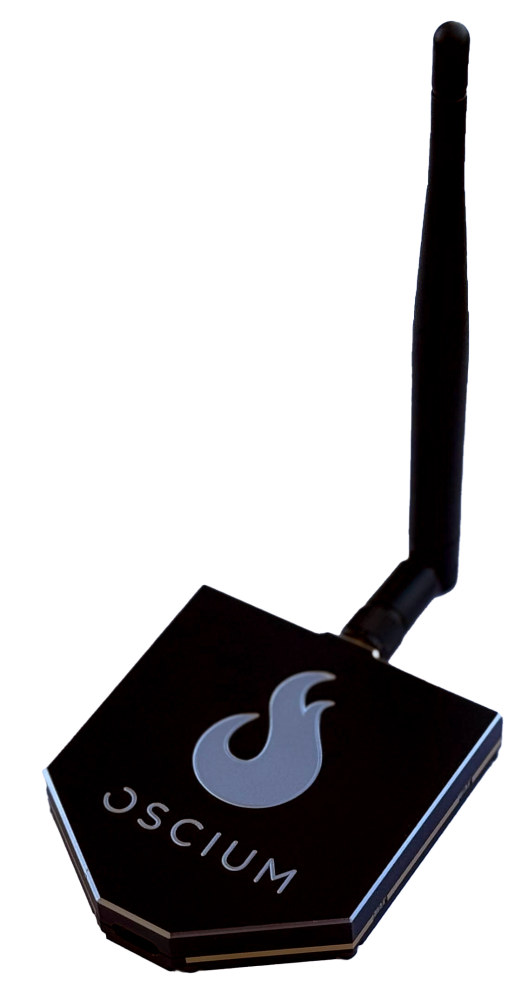
Wi-Spy Lucid gives you full visibility into 2.4 GHz, 5 GHz, and 6 GHz (Wi-Fi 6E) bands, monitoring both Wi-Fi and non-Wi-Fi activity with pinpoint precision. Paired with Chanalyzer’s visualization tools, it’s like putting on glasses after years of squinting—you’ll finally see your network clearly in real time.
Pinpoint and Eliminate Interference
With the Interference Finder Antenna, you’re not just looking for interference—you’re hunting it down. This directional antenna focuses your efforts, helping you zero in on the exact source of disruptions (goodbye, mystery microwave) so you can take action.
Monitor Channel Saturation and Intermittent Issues
Chanalyzer doesn’t just show you a list of access points; it gives you the full RF story. By combining Wi-Spy Lucid’s insights with AP data, you can analyze channel usage, manage congestion, and finally track down those annoying, intermittent interference gremlins.
Identify and Fix Wi-Fi Dead Spots
Nobody likes a Wi-Fi dead zone. Whether you’re planning a new network or keeping an existing one running smoothly, Chanalyzer’s tools let you map SSID signal strength and spot gaps in coverage. The result? Seamless connectivity and happier users.
Effortless Reporting for Clear Communication
Turn your findings into reports that don’t just inform—they impress. With Report Builder, you can quickly add snapshots, tables, and descriptions to create visually compelling PDFs that even your boss (or clients) will understand.
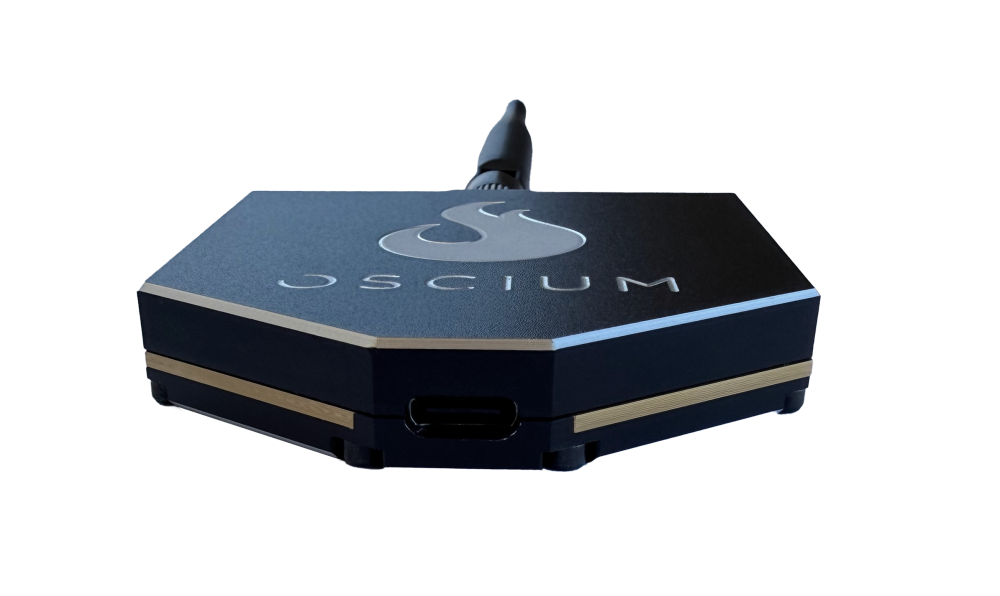
Hardware Expectations
More information on the Wi-Spy Lucid Spectrum Analyzer
Wi-Spy Lucid Comparison Chart
|  Wi-Spy Lucid | 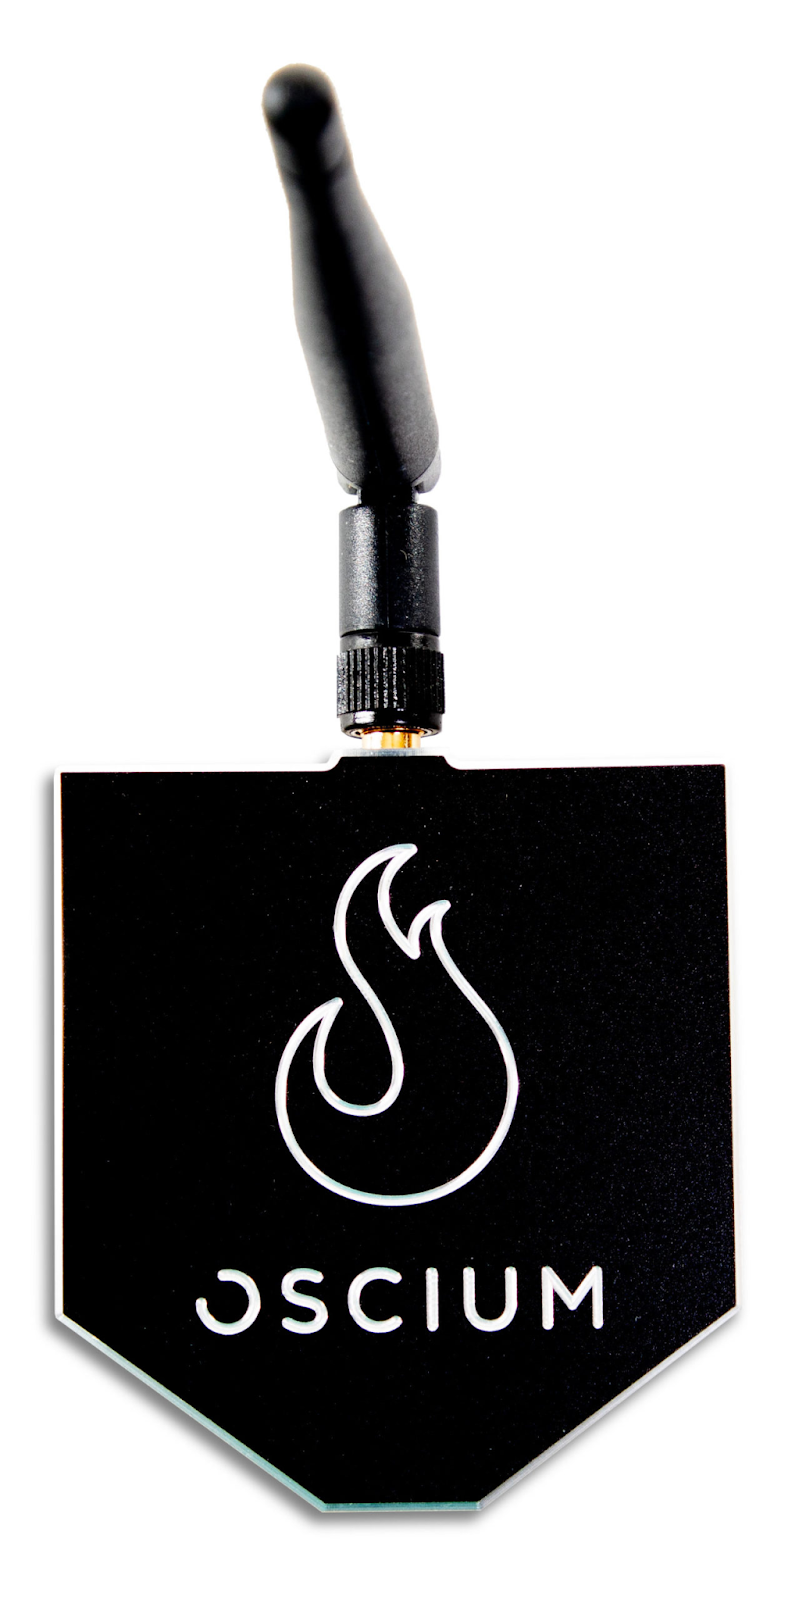 WiPry Clarity | 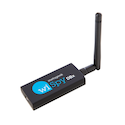
Wi-Spy DBx |
Frequency Range* | 2200-7250 MHz | 2200-7250 MHz | 2400-2495 MHz, 5150-5850 MHz |
Amplitude Range | -95 dBm to -5 dBm | -95 dBm to -5 dBm | -100 dBm to -6.5 dBm |
Amplitude Resolution | 0.5 dBm | 0.5 dBm | 0.5 dBm |
Frequency Resolution* | 25.4 kHz to 405.5 kHz | 25.4 kHz to 405.5 kHz | (2.4 GHz)
25.4 kHz to 405.5 kHz
(5 GHz)
23.4 kHz to 375.3 kHz |
Resolution Bandwidth* | 58 kHz to 812.5 kHz | 58 kHz to 812.5 kHz | (2.4 GHz)
58 to 812.5 kHz
(5 GHz)
53.6 to 750 kHz |
Default Frequency Resolution | (2.4 GHz) 390 kHz (5 GHz) 1.396 MHz (6 GHz) 1.786 MHz | (2.4 GHz) 390 kHz (5 GHz) 1.396 MHz (6 GHz) 1.786 MHz | (2.4 GHz) 333 kHz (5 GHz) 1497 kHz |
Sweep Time* | (2.4 GHz) 200 msec (5 GHz) 400 msec (6 GHz) 600 msec
| (2.4 GHz) 260 msec (5 GHz) 1000 msec (6 GHz) 1520 msec | (2.4 GHz) 507 msec (low 5 GHz) 1242 msec (mid 5 GHz) 1587 msec (high 5 GHz) 641 msec |
Antenna | RP-SMA | RP-SMA | RP-SMA |
Compatible Software | Chanalyzer Lite Chanalyzer 5 Chanalyzer 6 | Chanalyzer Lite Chanalyzer 5 Chanalyzer 6 | Chanalyzer 5 inSSIDer Office |
Length | 75mm (including RP-SMA connector) | 75mm (including RP-SMA connector) | 75mm (including RP-SMA connector) |
Width | 61mm | 61mm | 34mm |
Height | 11mm | 11mm | 13mm |
Additional Accessories | Oscium Directional Interference Finder | Oscium Directional Interference Finder | Alfa APA-M25 or MetaGeek Device Finder directional antenna |
* The Device Settings feature in Chanalyzer 5 adds the ability to change the minimum and max frequencies and adjust frequency resolution and filter bandwidth. Changing sweep parameters will affect the sweep time.
HARDWARE SPECIFICATIONS
- Hardware Frequency Range: 2.2 GHz – 7.25 GHz
- Frequency Resolution: 25 KHz
- Amplitude Range: -95 dBm to -5 dBm
- Filter Bandwidth: 58 KHz to 812 KHz
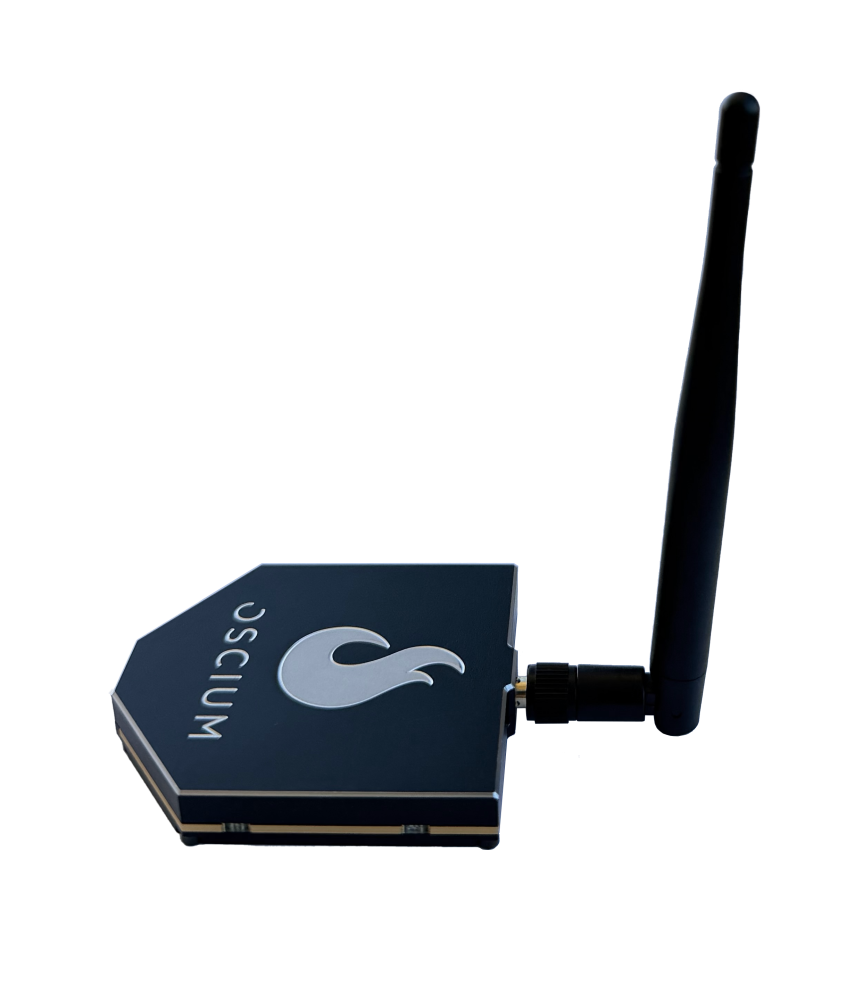
- Antenna: Included Tri-Band Omni-directional Antenna
- Antenna Port: RP-SMA
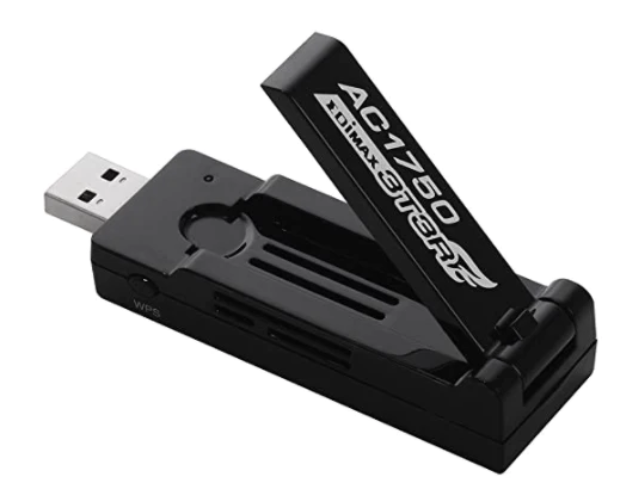
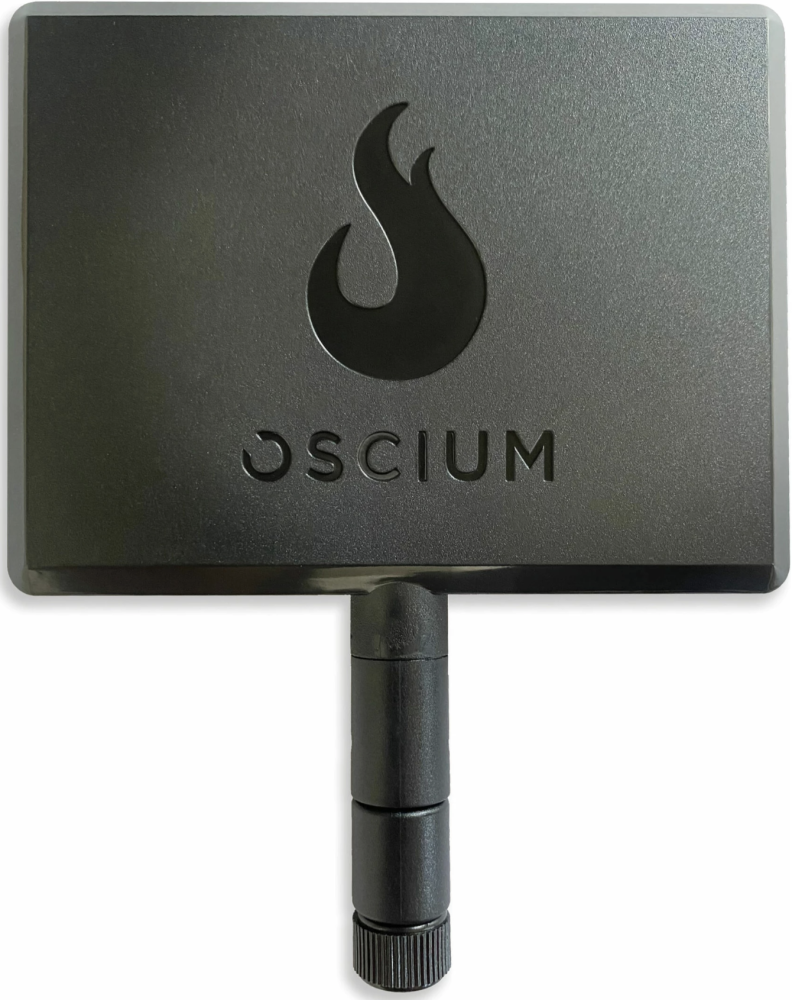
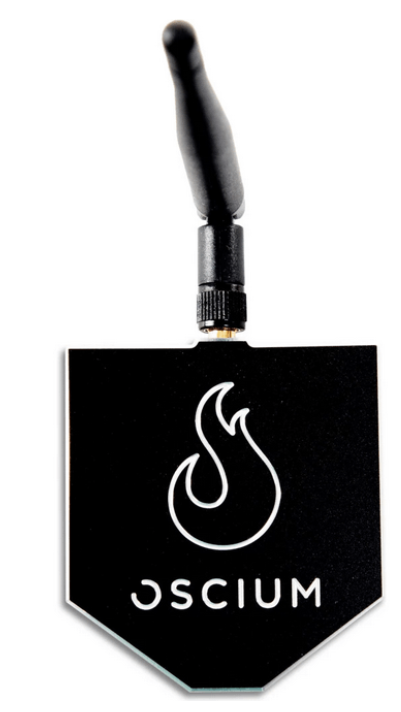
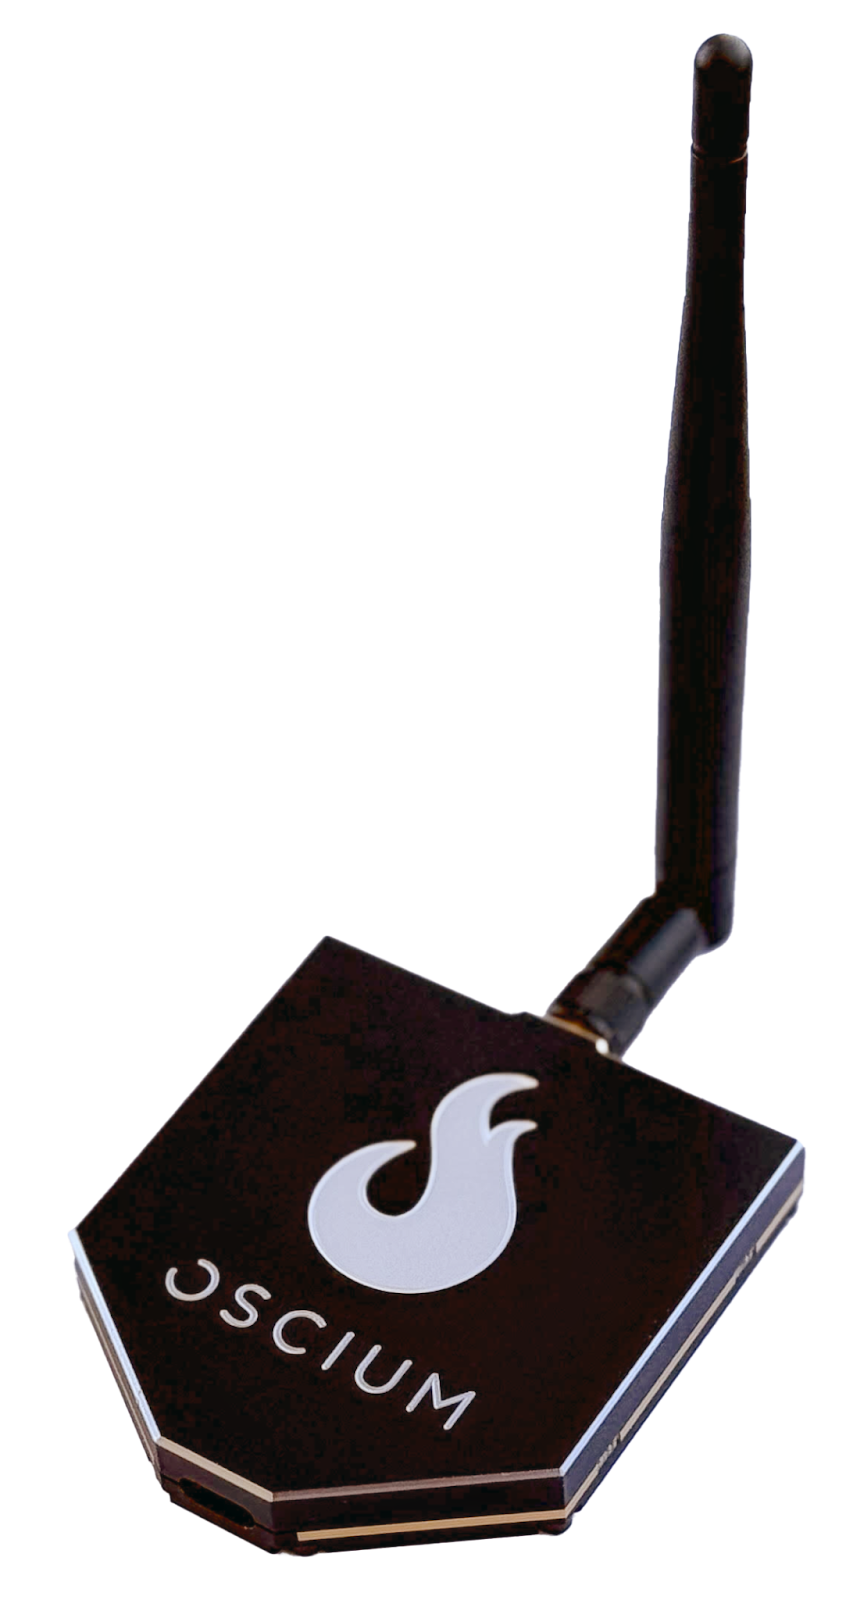
More information on the Interference Finder Antenna for Wi-Spy (2.4, 5GHz, & 6E).
Perfect for identifying the exact location of an interference source! About this item:
- Locate Exact Location of Wi-Fi Interference
- Tri-Band Wi-Fi Interference Finder
- Directional Antenna
- RP-SMA Connector: works with Oscium and non-Oscium products
- 6 dBi gain
- Boost repeater / AP signal to extend range
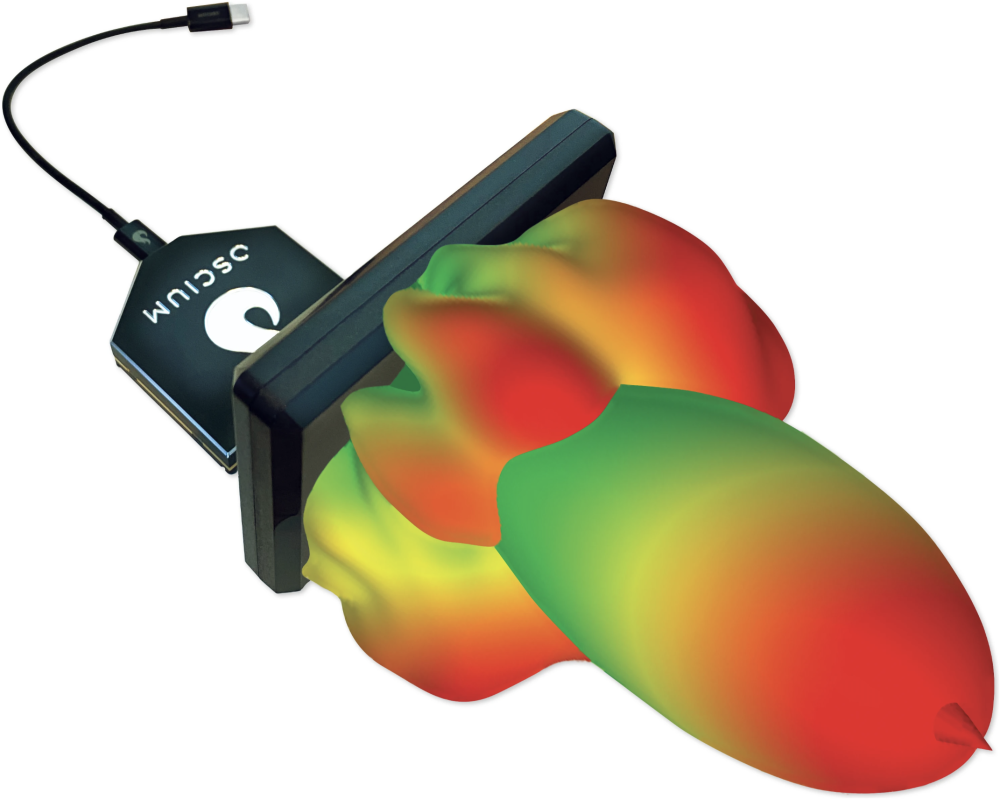
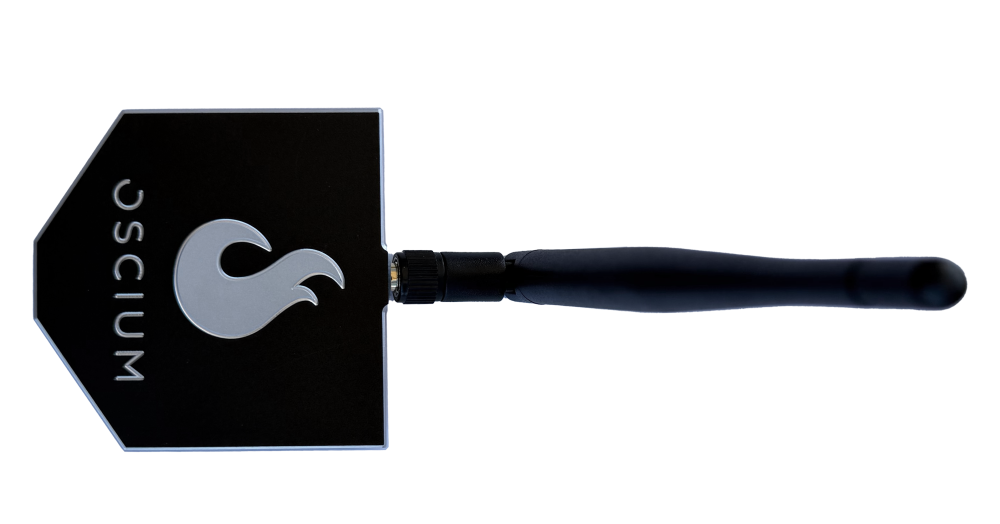
Be sure and use the paddle with the logo facing the direction of your interference source. The antenna propagation that is pictured is with the logo facing out.
Software Expectations
Chanalyzer 5 Software with Report Builder is back and it's better than ever!
POWERFUL TRI-BAND SPECTRUM ANALYSIS
Chanalyzer unlocks the full capability of Wi-Spy Lucid, a powerful tri-band spectrum analyzer that measures WiFi and non-WiFi activity in both the 2.4 GHz, 5 GHz and 6GHz bands. Chanalyzer utilizes radio frequency data from Wi-Spy to provide you with a real-time visual overview of your WiFi network environment.
LOCATE SOURCES OF INTERFERENCE

Once you're able to see interference, the next step is to eliminate it. Unlike the omnidirectional WiFi antenna in your laptop or wireless adapter, our Interference Finder Directional Antenna is highly focused to pinpoint non-WiFi sources of interference. This allows you to actively seek out and remove loud transmitters from your WiFi environment.
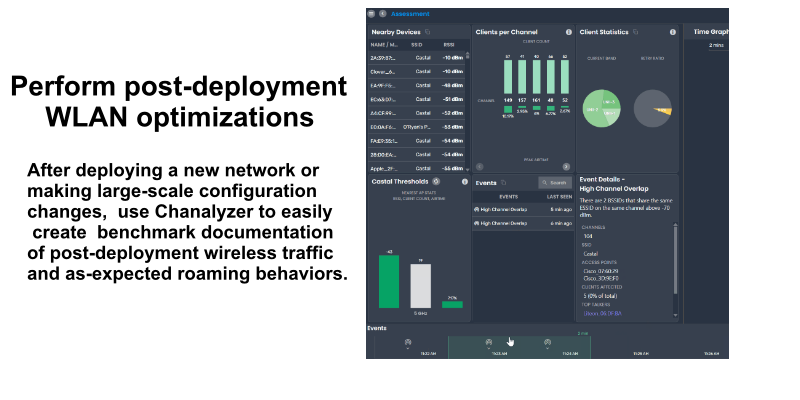
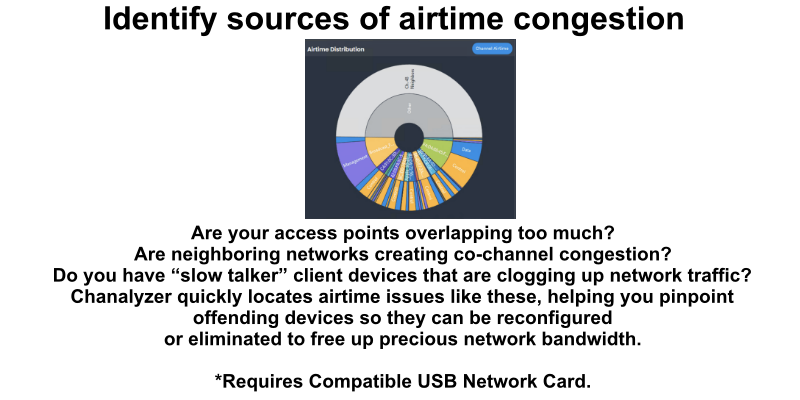
MONITOR CHANNEL SATURATION AND INTERMITTENT INTERFERERS

By graphing every access point within reach and pairing it with the raw RF information provided by Wi-Spy, Chanalyzer provides you with all the information you need to monitor and manage saturated channels. The built-in recording feature even allows you to track the most frustrating WiFi problem – intermittent interference – and come up with a plan to eliminate it for good.
FIND AND ELIMINATE WIFI DEAD SPOTS

REPORT YOUR FINDINGS WITH EASE
Identifying gaps in your coverage area is paramount, whether you are planning out a network the first time or testing existing coverage to maintain reliability. Chanalyzer quickly reads the wireless environment, displays every SSID within range, and reports the signal strength in real time so you can ensure quality coverage for your users.

Utilizing Report Builder – included in Chanalyzer Essential – you can add a snapshot of any image or table with just a few clicks. Then add your own pictures and descriptions (or just use the defaults) to provide context. After you’re done, export to PDF to create a visually compelling report of dead spots, saturation, and rogue APs that your boss or clients can understand.